How To Setup and Integrate Sentry.io with Node.js
How to integrate and use Sentry with Node.js

Spending time boing over what sentry is and what it’s used for seems a little redundant in this article. If you’re here, then chances are it’s because you’ve already read up on Sentry and you want to integrate it into your new or existing Node.js app. So lets jump right into it!
Sentry.io Account
Start by creating a new account, or logging into an existing account.

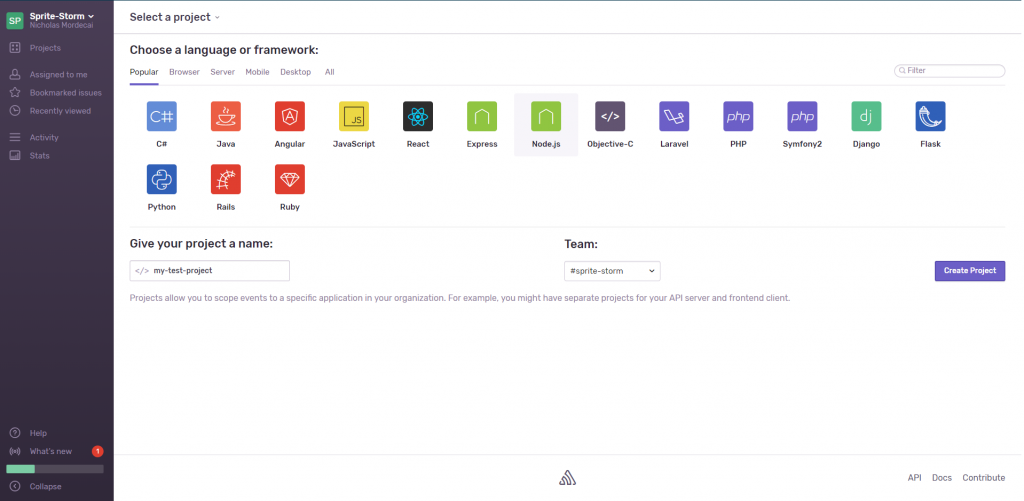
Now create a project, selecting Node.js as the framework and give your project a name.


Select again, Node.js as the application you wish to configure with. Configuration options will now appear on the screen.
Getting Started
$ npm install @sentry/[email protected] // or the latest version
// or
$ yarn add @sentry/[email protected] // or the latest version
In the entry point of your Node.js application, typically main.js or app.js; add the following lines:
const Sentry = require('@sentry/node');
Sentry.init({ dsn: 'https://[email protected]/123456789' });
Anywhere in your main file, where you have access to the object, you can call the following method:
Sentry.captureException(error);Of course, if there is no error, the error will be undefined and you will get a run-time error. A more realistic example may be this:
try {
    aFunctionThatMightFail();
} catch (err) {
    Sentry.captureException(err);
}
Globally Accessible
In almost all circumstances, you will want access to report errors, messages, and events without having to create a new instance of Sentry every time.
Make a file called log.js and paste the following code, substituting the DSN for your own provided in the Sentry platform.
const Sentry = require('@sentry/node');
Sentry.init({ dsn: 'https://[email protected]/123456789' });
module.exports = Sentry;
In any file, you can now require the exported module and log your errors. We will cover Sentry events later on.
const Sentry = require('./log');
// send an event to Sentry
Sentry.captureMessage('my message', 'warning');
// sent an error - automatically sends a callstack
try {
	functionThatFailed();
} catch (error) {
	Sentry.captureException(error);
}
// send a custom event
If you’re using ES6, or TypeScript then you can implement a singleton pattern and import it, rather than require it. I’ll do an example on this in another article.
Useful Options
Sentry provides us with various options to configure our integration. There are only 4 that I find are useful. If you want to look up more of the options, you can read their documentation here.
DSN
The URI that tells the Sentry SDK where to send all the events. For security, to avoid committing the DSN to git, consider using environment variables.
Debug
You can enable debug by setting it to true. Their API will then print any valuable information to the console in the event the SDK fails or has an error.
Release
Managing releases is often a headache, for any size software or business. Setting the release option when instantiating Sentry’s SDK is great for managing this. Sentry will filter and sort all captured events by the specific version. In short, you can extrapolate which bugs Sentry has removed or introduced with a specific version or release.
Environment
Going hand in hand with the point above. Being able to set an environment is fantastic when you have multiple duplicate servers/environments such as Production, Staging, and QA. Chaos will ensue if all the staging errors were to get muddled in with production bugs!
Message Stack Trace
By default, the exception has the stack trace built in, however; the message does not. This means you won’t get a stack trace when a new message is captured. It’s set to false by default as you don’t always need this, however for debugging or if you want highly detailed messages, then turn this on.
Initialisation
Sentry’s init method should now look a little something like this:
Sentry.init({
    dsn: 'https://[email protected]/123456789',
    attachStacktrace: true,
    debug: true,
    release: '1.5.4',
    environment: 'production'
});
First Errors
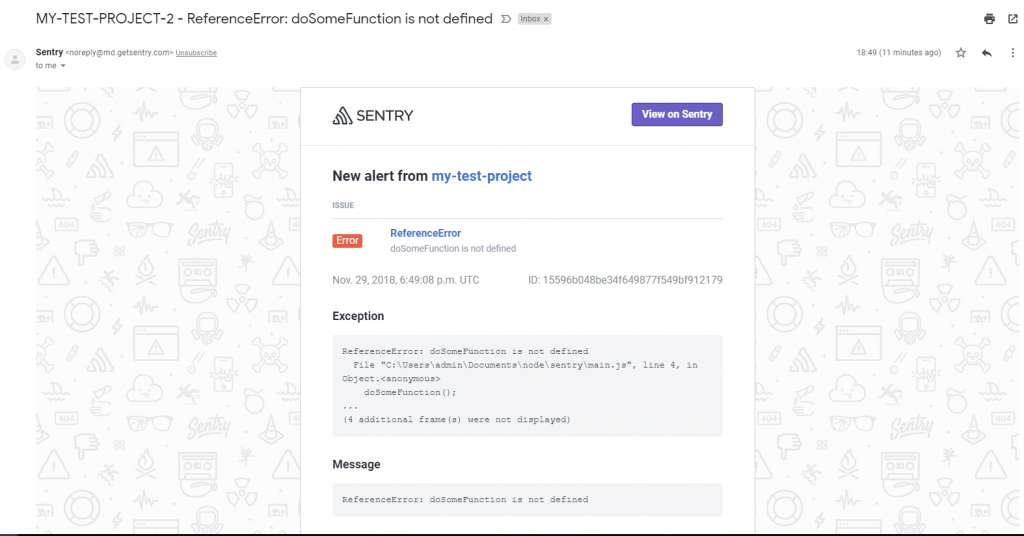
Now we’ve set Sentry up and configured it how we want to, let’s throw a few errors and see how they’re handled in the dashboard. I’ve created a try-catch block and attempted to call a function I know doesn’t exist.
try {
    doSomeFunction();
} catch(error) {
    Sentry.captureException(error);
}
Within a few seconds, the dashboard displays a new error and they send an email.


If we generate another error, identical to the last, then Sentry will stack the errors for us. You can increase the filtering to stop it reporting any errors if your code duplicates errors.

Sending Messages
Messages might not seem overly useful considering this is an error capturing platform. However, it’s crucial to monitoring your node.js app. Suppose you introduce a new code but you also have to keep your old code just for legacy fall-back. Once ‘depreciated’, you may wish to send a message within that legacy code so you know who, when, how often and the circumstances behind why your program executed legacy code.
Sending messages are simple enough. We will cover how to add extra fields such as users and context in the next section.
const Sentry = require('./log');
Sentry.captureMessage('something non-important');
Scope
Adding one time use information to an event is really important. You could change the global Sentry configuration, however you would have to change this for every single sentry event. Not to mention that due to the single threaded nature of Node, you might set the configuration at a time inside of a callback but have an exception thrown outside of this callback. This would completely mess up your entire error tracking and create some seriously messy bugs to trace.
To combat this, Sentry added someone really useful called scope. It’s a single callback function that you invoke with ‘withScope‘. Within this you can set whatever configuration you like knowing it’s a one time deal and you needn’t worry about it polluting your other events.
const Sentry = require('./log');
Sentry.withScope((scope) => {
  scope.setTag("area", "checkout");
  scope.setLevel('warning');
  scope.setUser({
    id: 42,
    email: "[email protected]"
  });
  Sentry.captureMessage('something non-important');
});
The above code is an example excerpt from a checkout. We have specified a new tag that records the area the error was produced in was the checkout. In addition to this, we also set the user’s email and ID for easier debugging.
If you want the scope to continue to all subsequent events, then you need to use the ‘configureScope‘ method. More information can be found on their documentation about Scopes and Hubs.
const Sentry = require('./log');
Sentry.configureScope((scope) => {
  scope.setTag("my-tag", "my value");
  scope.setUser({
    id: 42,
    email: "[email protected]"
  });
});
Stay tuned for a follow-up article looking more in-depth on using this in a larger project. I will also be showing how you can use this with TypeScript so the original source code is displayed in the stack trace.


I сould not resist commenting. Perfectly writtеn!